 Campaign Report Description -- Overview
Access
If your Campaign Report includes only a single Campaign as the data source, then this report is available by selecting "Campaign Report" from the Campaign Report navigation menu.
If your Campaign Report includes multiple Campaigns as the data source, then this report is available by selecting "Roll Up Summary" from the Campaign Report navigation menu. All the metrics in the report have help icons that on hover will describe what the metric means in the report.
View Sample OverviewView Sample Overview
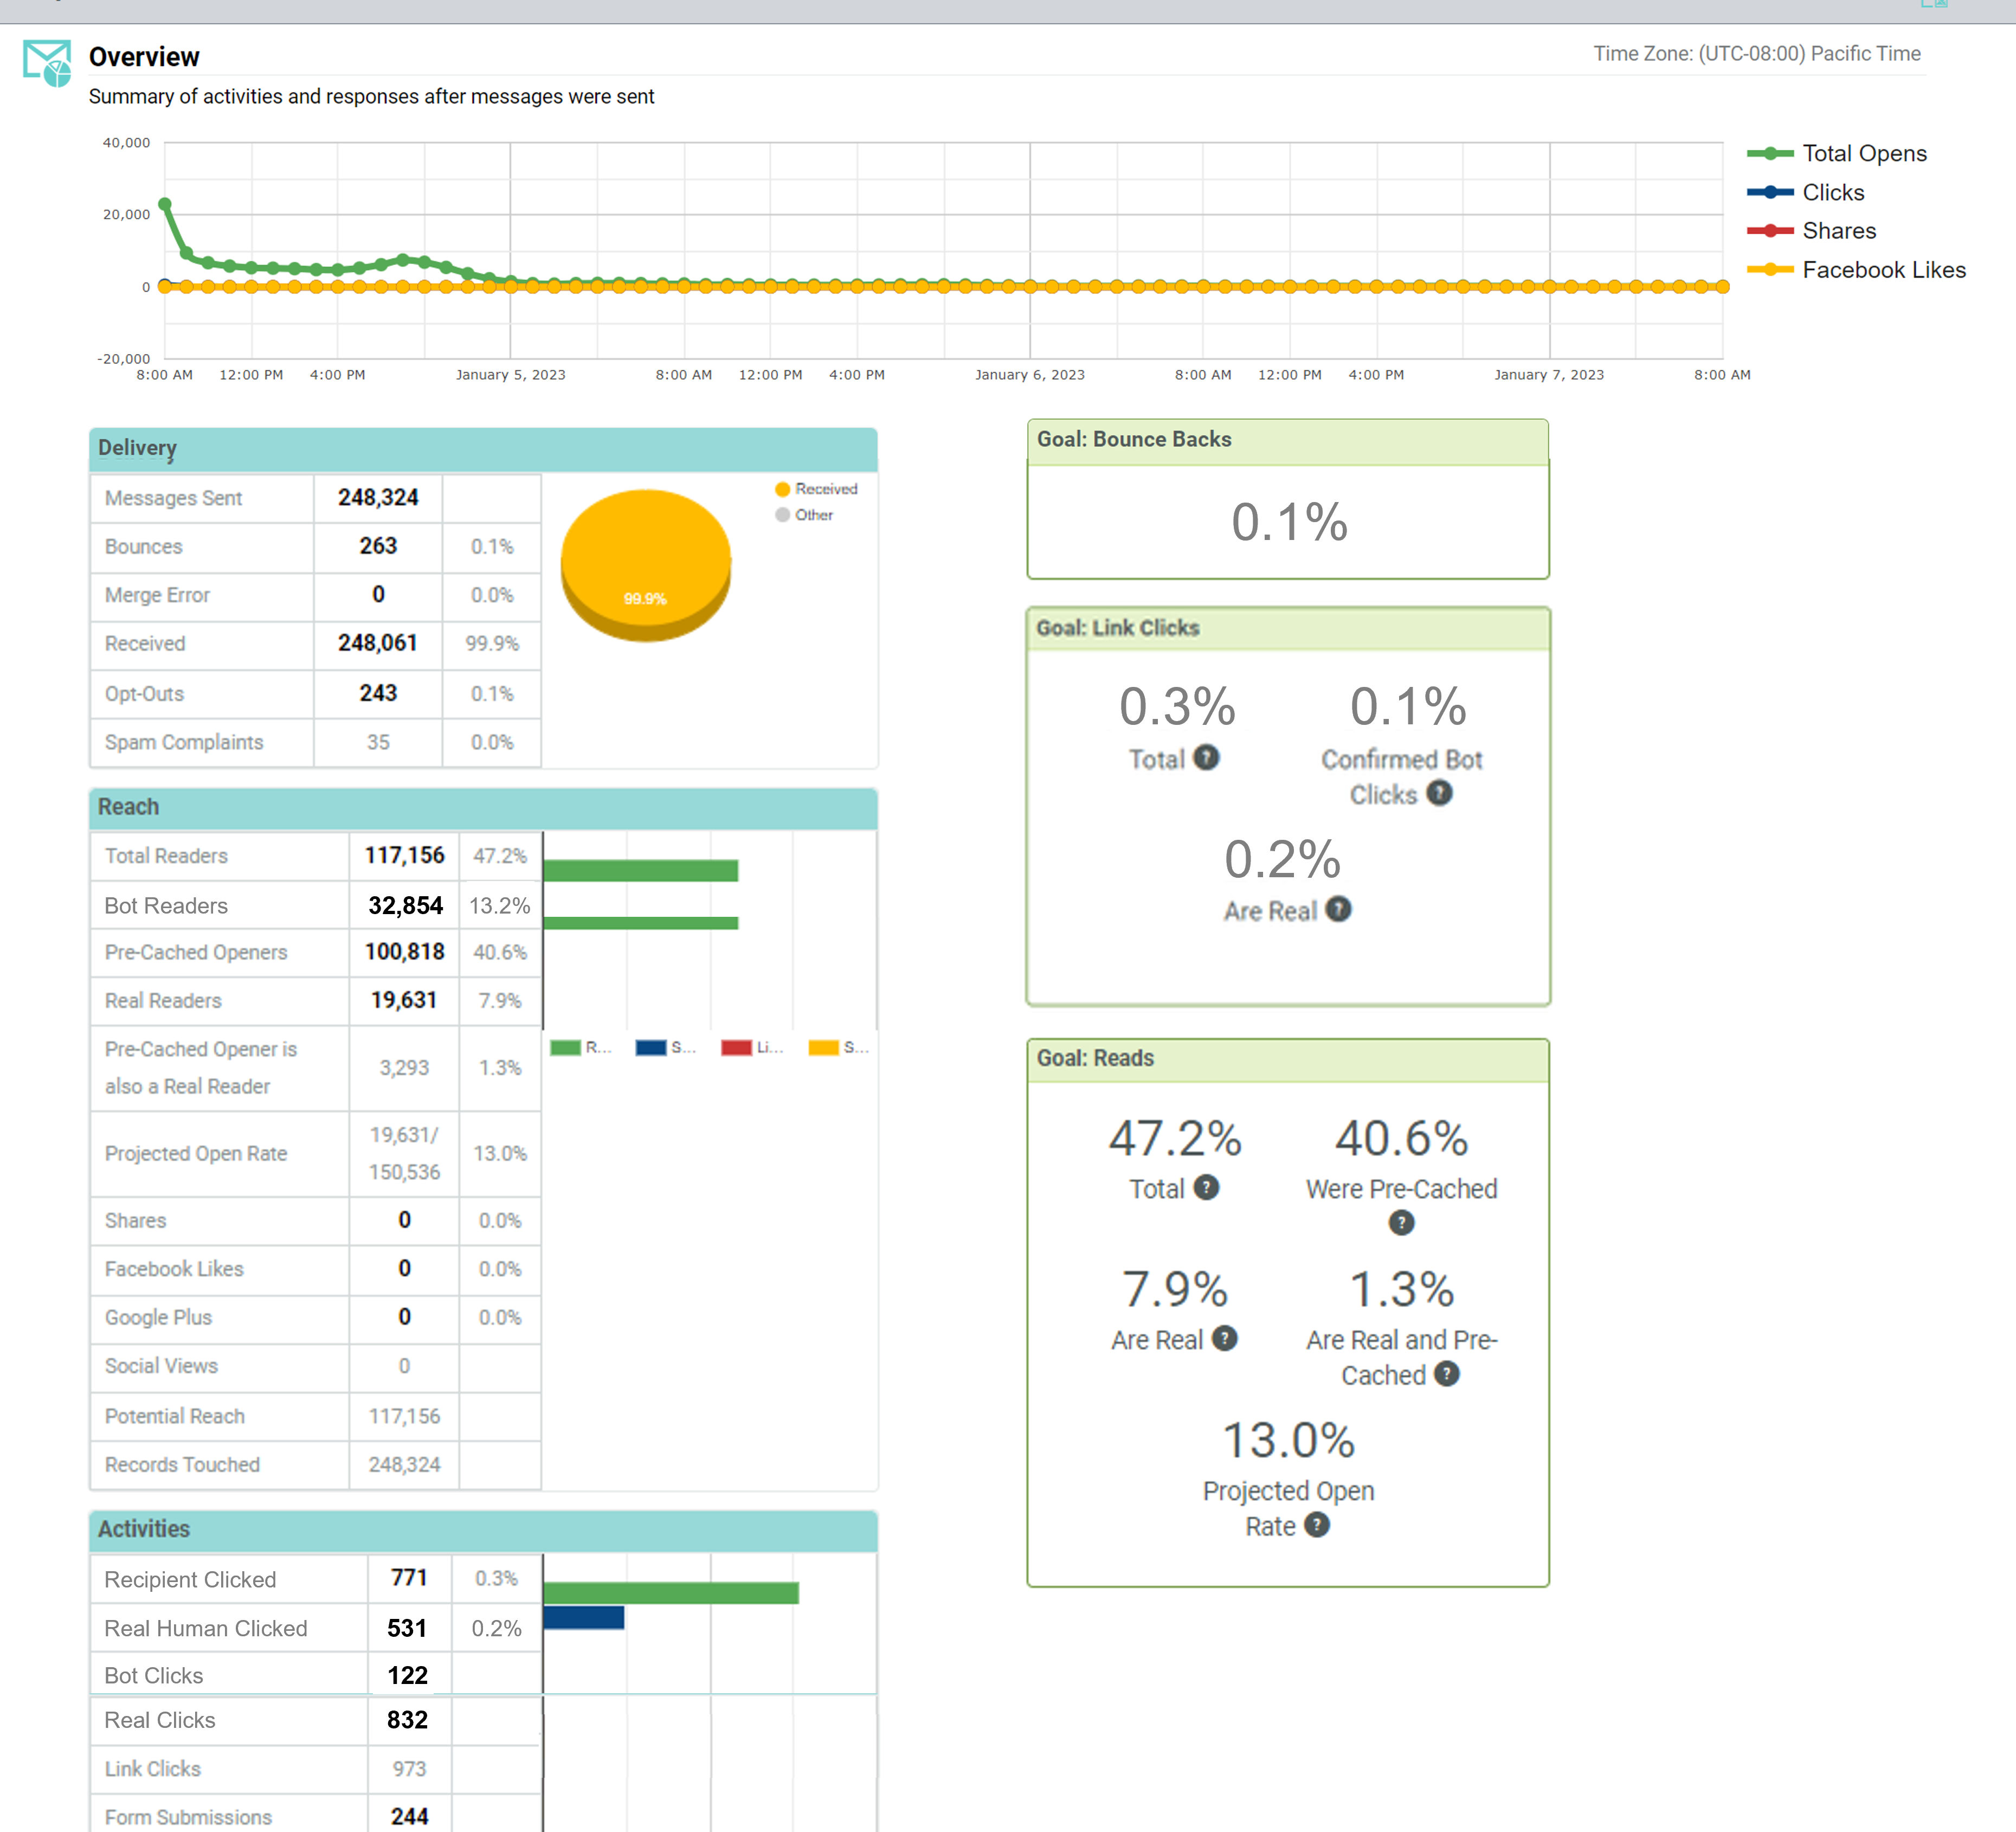
Timeline
The Timeline depicts the activities and responses generated by this Campaign over time. The Timeline plots the number of total opens, total clicks, shares, and Facebook Likes.
Delivery
The Delivery section provides high-level counts related to the number of messages sent in the Campaign, as well as bounces and opt-out requests. The metrics listed in this section are:
-
Messages Sent: The number of messages sent from the Campaign. This count represents your Campaign audience, minus any records that were suppressed (such as Exclusion Lists, Global Bans, invalid email addresses, unsubscribed individuals, etc.).
-
Messages Deleted: When the Stop Night Delivery feature is enabled, and has been configured to not to hold on to the remaining message for the next day, these stopped messages will be deleted. This metric is the number of messages in the campaign that were deleted by this process.
-
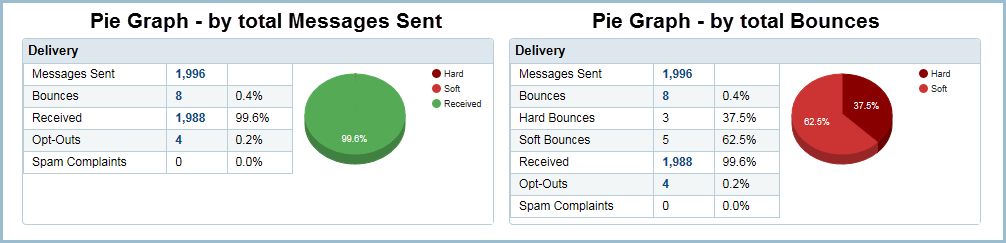
Bounces: The total number of both hard and soft bounces received for the Campaign, and its percentage representation with respect to the Messages Sent. More detailed bounce information can be found in the Bounce Backs report.
-
Hard Bounces (click the pie graph to toggle on the Bounce detail): The number of Hard Bounces received for the Campaign, and its its percentage representation with respect to the total Bounces.
-
Soft Bounces (click the pie graph to toggle on the Bounce detail): The number of Soft Bounces received for the Campaign, and its its percentage representation with respect to the total Bounces.
-
Temporary (click the pie graph to toggle on the Bounce detail): The number of Temporary Soft Bounces received for the Campaign, and its percentage representation with respect to the total Bounces.
-
Merge Error: The number of messages that failed during the Merge and Send process. This metric encompasses the following error types:
-
Email:
-
The email address is malformed or contains invalid characters.
-
The message content contains invalid XSLT code (for XSLT 1.0 only).
-
The domain name is incorrect or doesn't exist in the address to which the message was sent.
-
SMS Text:
-
The message content contains invalid XSLT code (for XSLT 1.0 only).
-
The recipient's mobile phone number is missing from the sending table.
-
The message content is empty.
-
Database errors, such as invalid database location, execution timeout, or insert error.
-
Push Notification:
-
The transaction rate exceeded the allowable rate.
-
The certificate is invalid, or access to the certificate is denied.
-
The device token is invalid or disabled in the endpoint.
-
Connection issues.
-
Received: The number of messages that were delivered to the Campign audience (#Messages Sent – #Bounces), and its percentage representation with respect to the Messages Sent.
-
Opt-Outs: The number of unsubscribe requests received for the Campaign, and its percentage representation with respect to the Messages Sent. More detailed opt-out information can be found in the Opt-Outs report.
-
Spam Complaints: The number of spam complaints received for the Campaign, and its percentage representation with respect to the Messages Sent.
The pie graph in this section visually depicts the percentage of the total Messages Sent that were Hard Bounces, Soft Bounces, and Received.
If you click on the pie graph, the view toggles to show the percentage of the total Bounces that were Hard Bounces and Soft Bounces. The display of counts is also updated to show detailed counts for Hard and Soft Bounces.
View Sample Bounce DetailView Sample Bounce Detail
The above counts represent a segment of the Campaign's total audience. Some of these segments can easily be turned into Filters and Export Templates. If you click on the desired count, the system displays a pop-up menu with two options: "Create Filter" and "Create Export."
For example, let's say you want to create a Filter out of the "Bounces" segment of your Campaign audience. If you click on the "Bounces" count, then select the "Create Filter" option, the system will create a Filter with a rule consisting of the Filter Activity "Bounce Back," with this Campaign as the Activity criteria.
Reach
The Reach section indicates how your campaign was viewed -- whether directly via receipt of the message, or through different social media channels, such as shares, Facebook likes, and social views. The metrics listed in this section are:
-
Total Readers: This indicates the number of messages that were opened or clicked from the Campaign, and its percentage representation with respect to the Messages Sent. A "Read" is defined as someone who either: clicked on a link in the plain text version of your message, or someone who received the HTML version of your message, and loaded the open pixel in their email client when they opened it.
-
Bot Clickers: The number of unique messages that were clicked in by bots.
-
Pre-Cached Openers: This indicates the number of false "opens" that the platform identified as being a result of Apple's MPP pre-cache process, and its percentage representation with respect to the Messages Sent.
-
Real Readers (if you have the Mail Privacy Protection feature enabled): This indicates the number of human (not bot clicks) who opened or clicked the email, and its percentage representation with respect to the Messages Sent.
-
Pre-Cached Opener is also a Real Reader (if you have the Mail Privacy Protection feature enabled): This indicates the number of pre-cached messages that recipients read outside the Apple app and/or clicked on a link, and its percentage representation with respect to the Messages Sent.
-
Projected Open Rate: This indicates the open rate of the recipients whose interactions were not hidden by Apple MPP and its percentage representation with respect to the Messages Sent.
-
Shares: The number of people who clicked on a Share-to-Social link, and its percentage representation with respect to the Messages Sent.
-
Facebook Likes: The total number of times the Facebook Like Button was clicked, and its percentage representation with respect to the Messages Sent.
-
Social Views: The total number of times the content posted on social websites through a Share-to-Social link was then shared or clicked.
-
Potential Reach: The metric takes the number of unique users and adds the number of friends, and friends of friends, that may also read the Campaign via social networks. This number is only significant when using Campaigns in conjunction with social networks.
-
Records Touched: The total number of unique records that received / read the message across all Campaigns included in the report. For example, if your report compares multiple Campaigns, and some recipients received more than one Campaign, this metric will measure that individual only once.
The bar graph in this section visually depicts the counts for Total Readers, Shares, Likes, and Social Views.
The above counts represent a segment of the Campaign's total audience. Some of these segments can easily be turned into Filters and Export Templates. If you click on the desired count, the system displays a pop-up menu with two options: "Create Filter" and "Create Export."
For example, let's say you want to create a Filter out of the "Shares" segment of your Campaign audience. If you click on the "Shares" count, then select the "Create Filter" option, the system will create a Filter with a rule consisting of the Filter Activity "Share to Social," with this Campaign as the Activity criteria.
Activities
The Activities section compares recipient activities, such as unique clicks, form submissions, and web events. The metrics listed in this section are:
-
Recipients Clicked: The total number of unique delivered messages that registered a click
-
Real Humans Clicked: The total number of unique delivered messages that registered one or more clicks by a real human.
-
Bot Clicks: The total number times that bots clicked in the campaign, this can include multiple clicks by various bots within the same message.
-
Real Clicks: The total number of real clicks by humans in the campaign, this can include multiple clicks by a recipient within the same message.
Bots and Real people can both click into the same recipient’s message, in which case the delivered message will be represented in both metrics.
-
Link Clicks: The number of unique links that have been clicked by human or bot (if 10 recipients receive an email that contains 5 links and each clicks on all 5, Link Clicks will = 50) . More detailed link click information can be found in the Link Click Activity report.
-
Form Submissions: The number of times a specific Web Form was submitted. More detailed Web Form activity information can be found in the Web Forms & PURLs report.
-
Mobile Responses: The number of unique mobile (SMS) response values for this Campaign, and its percentage representation with respect to the Messages Sent.
-
Web Events: The number of Web Event occurrences collected via the Messaging JavaScript API on external sites and its percentage representation with respect to the Messages Sent.
-
Custom Responses: The number of Custom Response values for the Campaign and its percentage representation with respect to the Messages Sent.
The bar graph in this section visually depicts the counts for People Clicks, Form Submissions, SMS Responses, and Web Events.
The above counts represent a segment of the Campaign's total audience. Some of these segments can easily be turned into Filters and Export Templates. If you click on the desired count, the system displays a pop-up menu with two options: "Create Filter" and "Create Export."
For example, let's say you want to create a Filter out of the "Form Submissions" segment of your Campaign audience. If you click on the "Form Submissions" count, then select the "Create Filter" option, the system will create a Filter with a rule consisting of the Filter Activity "Form Submissions," with this Campaign as the Activity criteria.
Goal Sets
Report Goal Sets provide a visual method for indicating if a specific goal or criteria (often referred to as a Key Performance Indicator, or KPI) has been met. You can create your own custom Goal Sets, then assign them to the Campaign Report as part of the report parameters (see Campaign Reports for more details).
If you don't select a custom Goal Set, then the system will display the default Goals, which are Bounce Backs, Reads, and Link Clicks.
Reads
The Reads goal includes the following metrics:
Total: The percentage of the received messages that were opened.
Were Pre-Cached: The percentage of messages that were pre-cached by Apple.
Are Real: The percentage of messages opened or clicked by a human.
Are Real and Pre-Cached: The percentage of pre-cached messages that recipients read outside the Apple Mail app, and/or clicked on a click.
Projected Open Rate: The percentage of open rate of recipients whose interactions were not hidden by Apple MPP.
Link Clicks
The Link Clicks goal includes the following metrics:
Total: The percentage of delivered messages that had links clicked.
Confirmed Bot-Clicks: The percentage of delivered messages that were clicked in by bots and are not because of human activity.
Are Real: The percentage of delivered messages that were clicked in by real humans.
Messages Clicked In By Humans
This goal includes the following metric:
Are Real: The percentage of delivered messages that were clicked in by real humans.
Back to Campaign Report Description