 Campaign Report Description -- Domain Delivery
Access
The Domain Delivery report is available by selecting "Domain Delivery" from the Campaign Report navigation menu.
View Sample Domain Delivery ReportView Sample Domain Delivery Report
Description
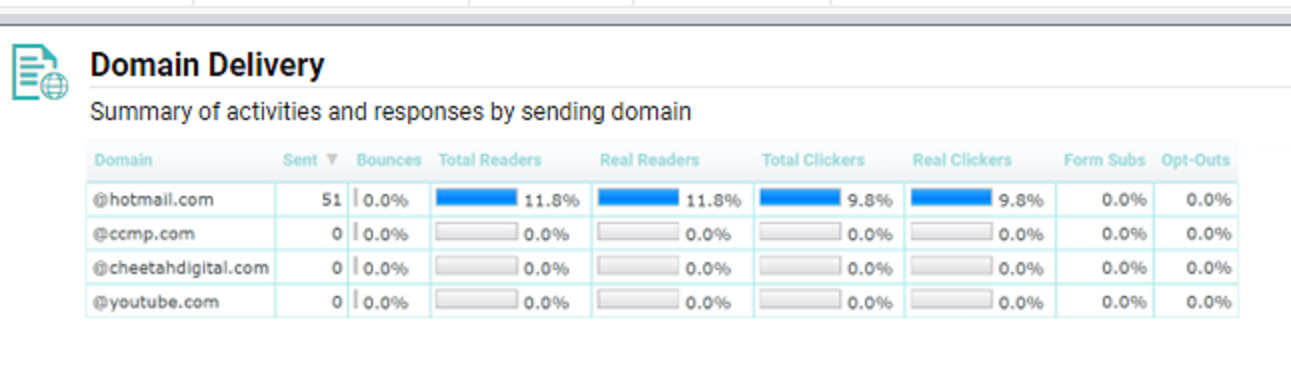
The Domain Delivery report provides additional detail on the recipient email domains, and how those domains performed against each other. The report will include the domains listed in the Update Options screen.
For each domain, the report lists the number of sent messages, and the percentage of the sent quantity that resulted in the following actions -- Bounces, Total Readers (including pre-cached opens), Real Readers (excluding pre-cached opens and Bot clicks), Total Clickers (including pre-cached opens), Real Clickers (excluding pre-cached opens and Bot clicks), Form Submissions, and Opt-Outs.
A bar graph is displayed next to each of these actions. These bar graphs are proportional to each other, and are intended to provide a quick, visual way of comparing domains. The largest value for each action will have a "full" bar.
For example, let's say that @mac.com had the highest read rate in your Campaign, at 15.5%. The bar graph for @mac.com will appear as full.

Then let's say that @verizon.net has a read rate of 7.9%. The bar graph for @verizon.net would appear as half-full, as this value is roughly half of the @mac.com results. In this manner, you can quickly compare the read rates for the domains against each other.

By default, the list of domains is sorted alphabetically by Domain in ascending order. To sort by a different column, click on the title for the desired column. The list is refreshed to sort by that column in ascending order. Click the same column a second time to toggle the sort order to descending.
Back to Campaign Report Description